
Your Source for Cutting-Edge Research

High-throughput assays for epigenomic profiling are numerous, and new protocols are being developed continuously. The most common epigenomic assays focus on:
To study the epigenome's direct effect on gene expression, epigenomic measurements are often complemented with RNA-sequencing experiments in the same setting. Single-cell experiments, particularly single-cell ATAC-sequencing, are increasingly performed as a co-assay with single-cell RNA-sequencing. This yields gene expression and chromatin accessibility profiles from the same individual cells.

The analysis workflow for most sequencing-based epigenomic data involves identifying, annotating, and analyzing peaks, or genomic regions with a signal of interest. The raw sequencing reads are first quality-controlled and aligned to a reference genome. Possible control libraries are used to normalize the read coverage signal. Peaks in the signal are identified using a peak caller tool. To enable further analysis, peaks are annotated with relevant information such as read statistics and near or overlapping features.

Annotated peaks across the sample set are visualized using PCA (and UMAP or t-SNE algorithms for single-cell data) and heatmaps. These visualizations help in optimizing the peak calling process and answer questions such as:

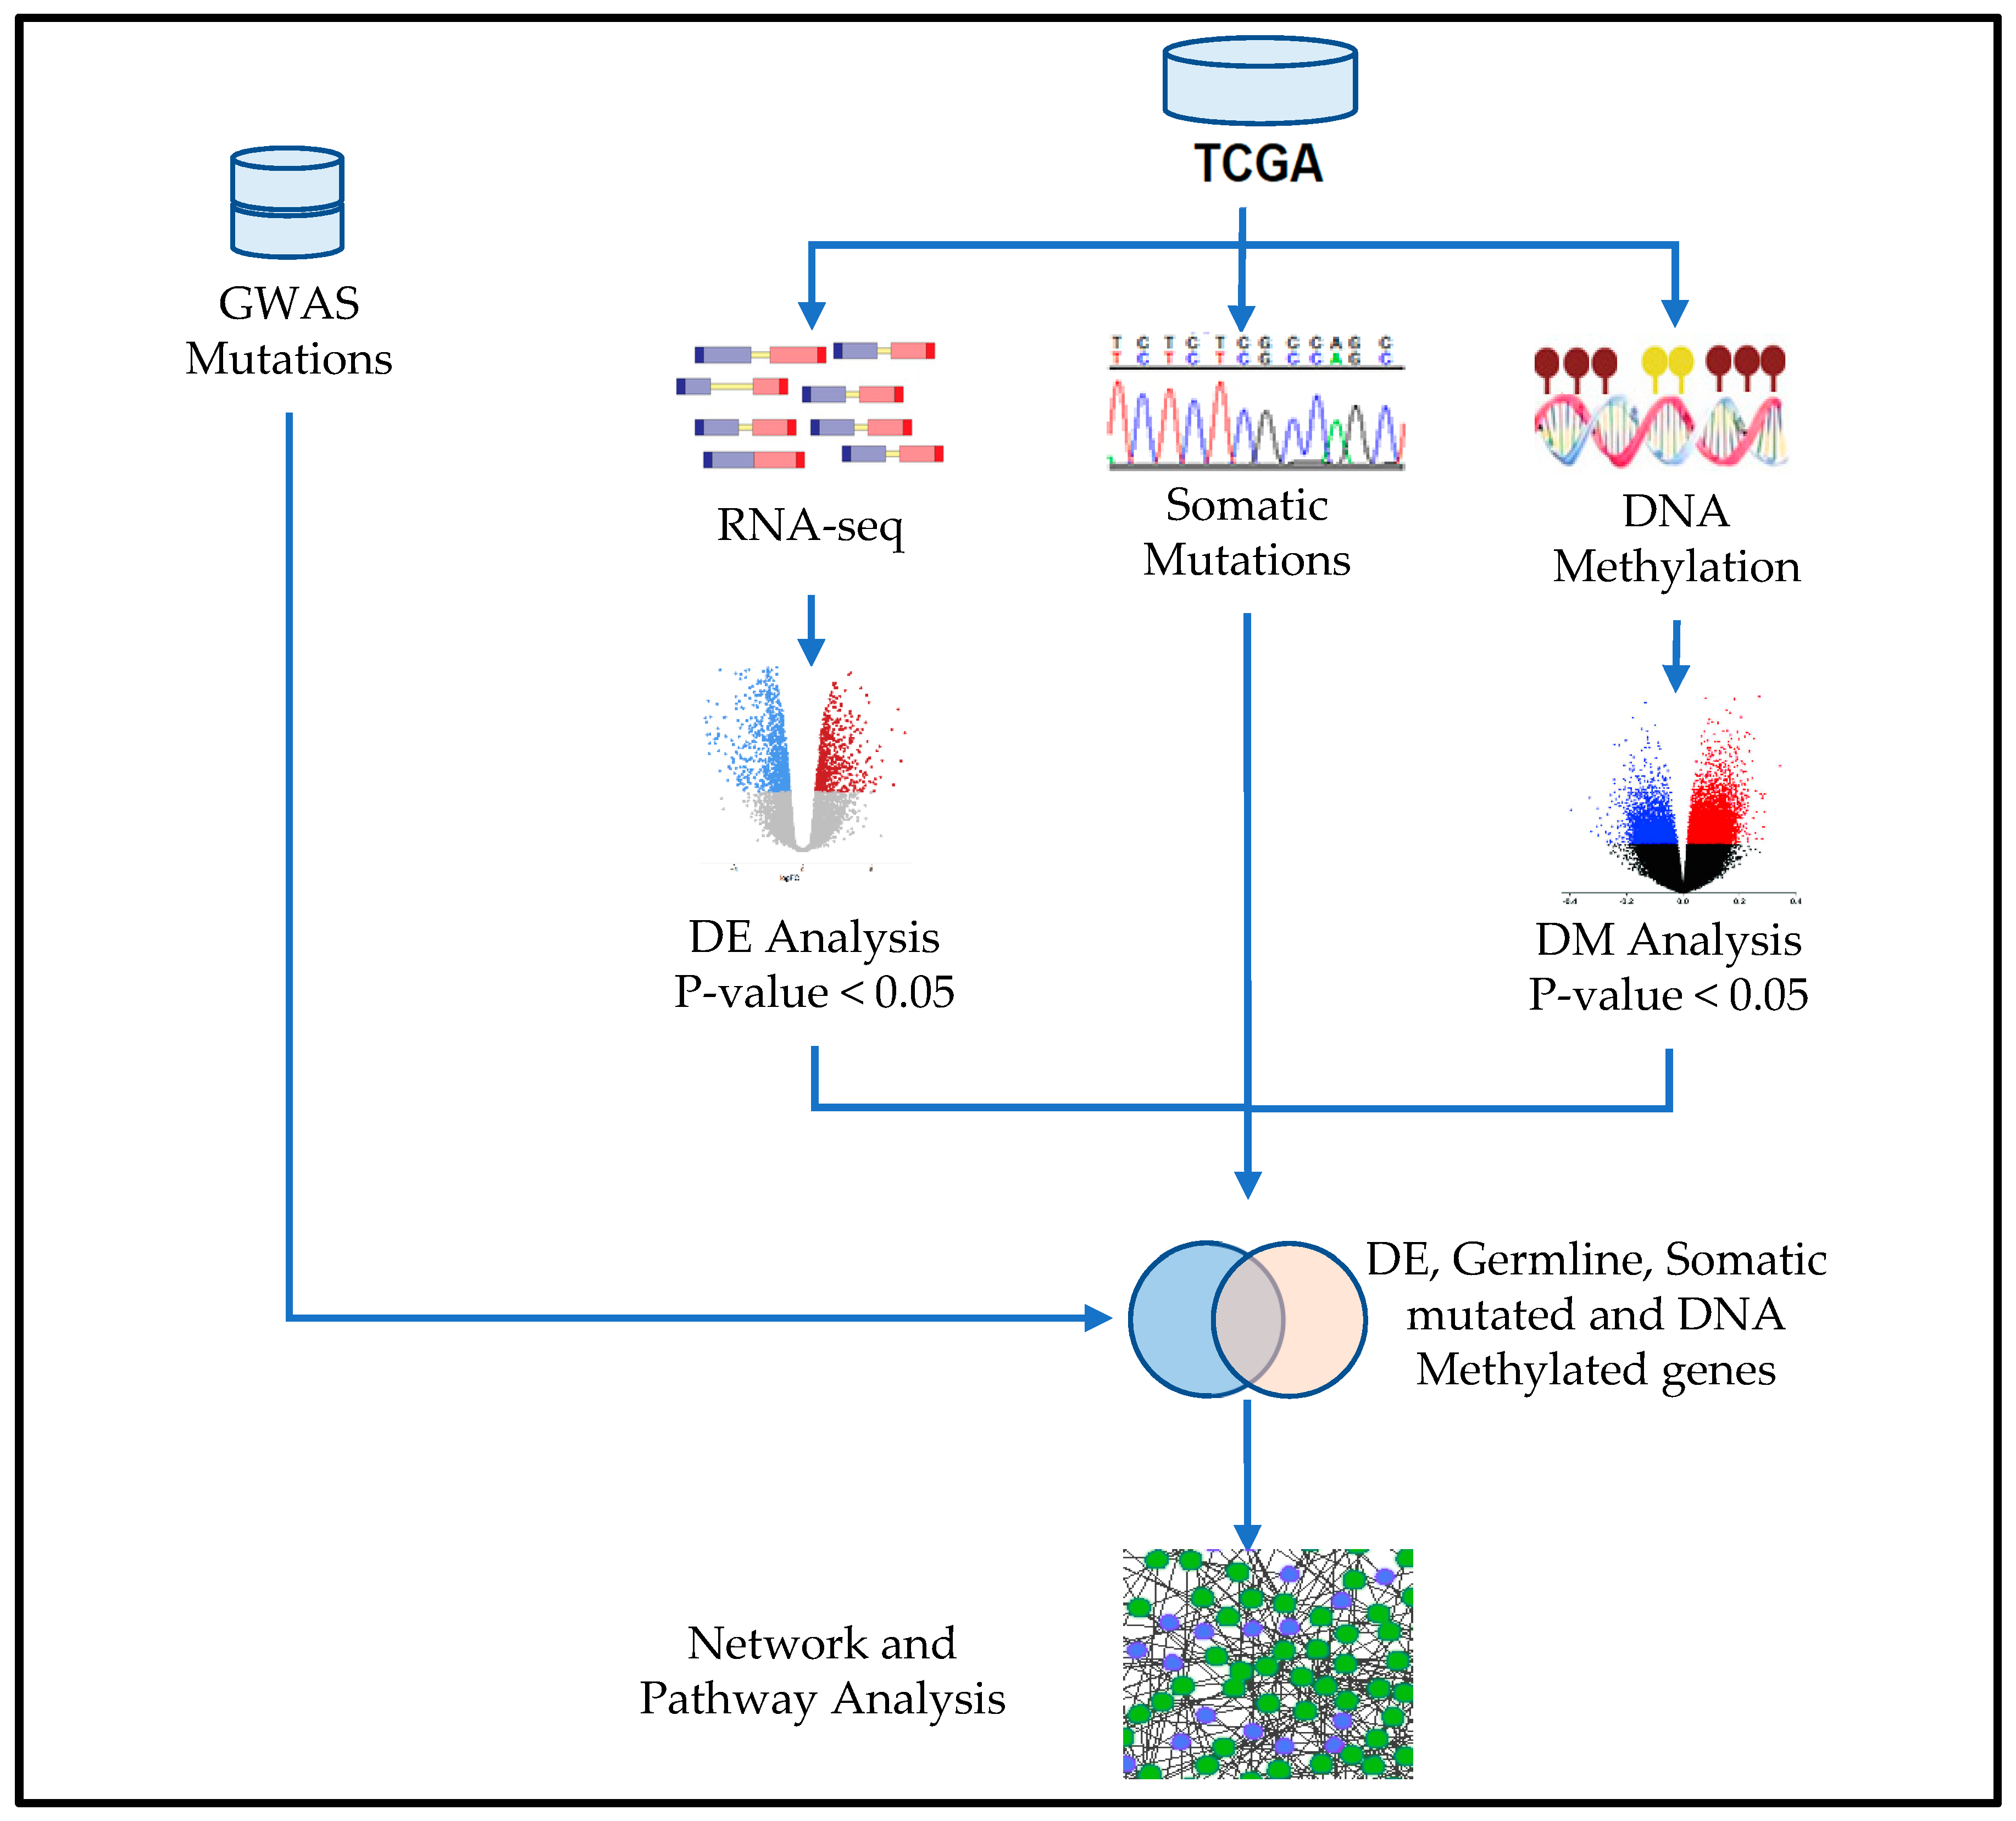
To compare different conditions, the identified peaks can be statistically compared, or differential peaks can be directly called from the respective read coverage signals. Similar to differential gene expression analysis, differential peak analysis yields estimates on the effect size and statistical significance. These statistics can be visualized as a volcano plot. Overlapping binding motifs at the peaks can be statistically compared between conditions and visualized as volcano plots.
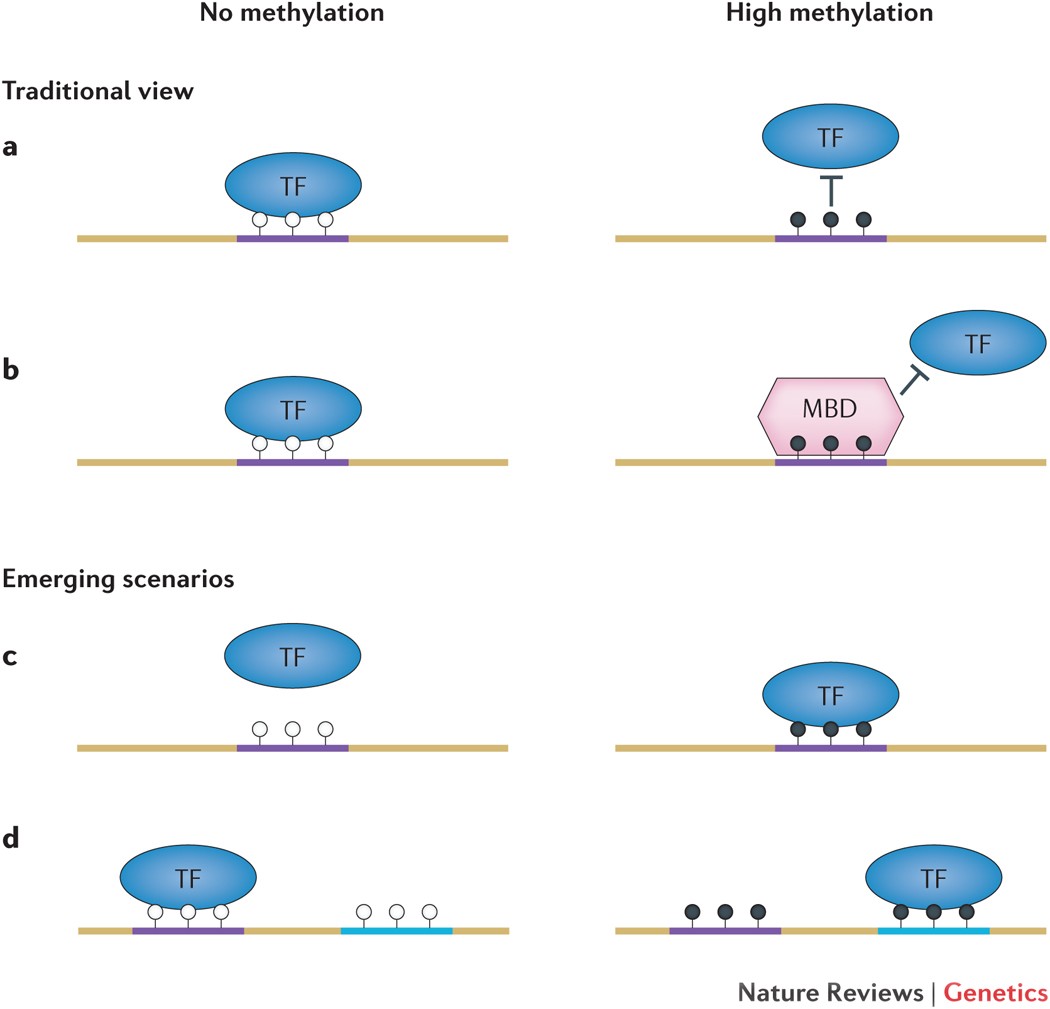
ChIP-seq and related protocols can be used to identify transcription factor (TF) binding sites across the genome. TF footprinting, using ATAC-seq data, can be used to identify binding sites of all DNA-bound proteins in parallel, through an analysis called TF footprinting. TF footprinting can be used to study the combined effects of TFs on gene expression in a very high-throughput manner.
The analysis of DNA methylation data starts with the quality control and alignment of sequencing reads, and proceeds to calling the methylated sites. Detected methylated sites are used to identify larger regions of DNA methylation or differentially methylated regions (DMRs) between samples. Possible downstream analyses for DNA methylation data include integration with gene expression data, epigenetic biomarker discovery, and biological age analysis.
Performing RNA-seq and epigenomic sequencing on the same samples enables integrative analyses to study gene regulatory programs genome-wide. Regulatory connections can be identified between enhancers and their target genes, as well as transcription factors and their targets, building on evidence from both gene expression and the epigenomic status of regulatory elements.