
Your Source for Cutting-Edge Research

Every RNA-Seq expression study incorporates an exploratory analysis. After the raw sequencing reads of an RNA-seq experiment have been quality controlled and gene counts derived, the data set is visualized using Principal Component Analysis (PCA) and expression heatmaps to unveil its general patterns. These visualizations help us answer questions such as:
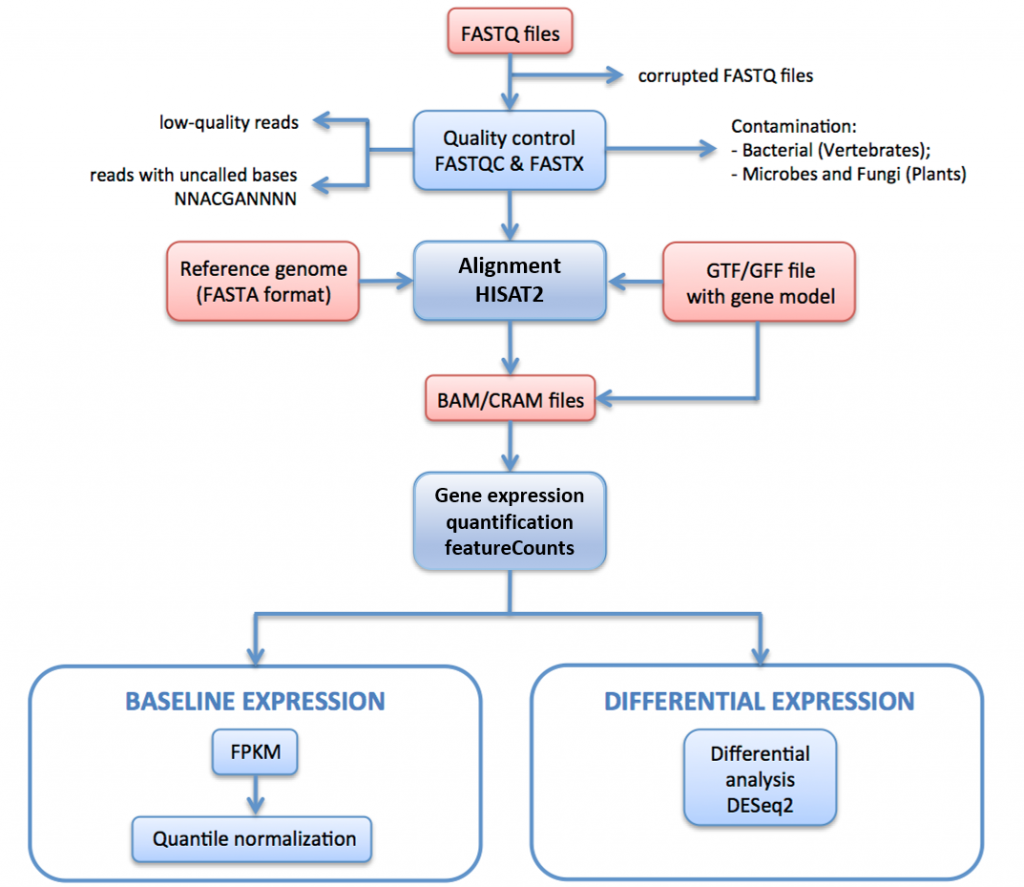
Differential expression analysis is a statistical comparison of two sample groups. It results in differential expression statistics for each detected transcript, such as the fold change and statistical significance. These statistics are typically visualized using a volcano plot. The genes which are found to be up- or down-regulated can be further visualized as heatmaps or boxplots, for instance.
As a statistical analysis, this phase of an expression study benefits from the statistical power brought by biological replicates. Three biological replicates per condition is a common "rule-of-thumb" minimum, but it only allows for reliable detection of genes with relatively large expression differences. With a careful experimental design and sufficient sample size, subtler differences can be detected and confounding factors controlled for.
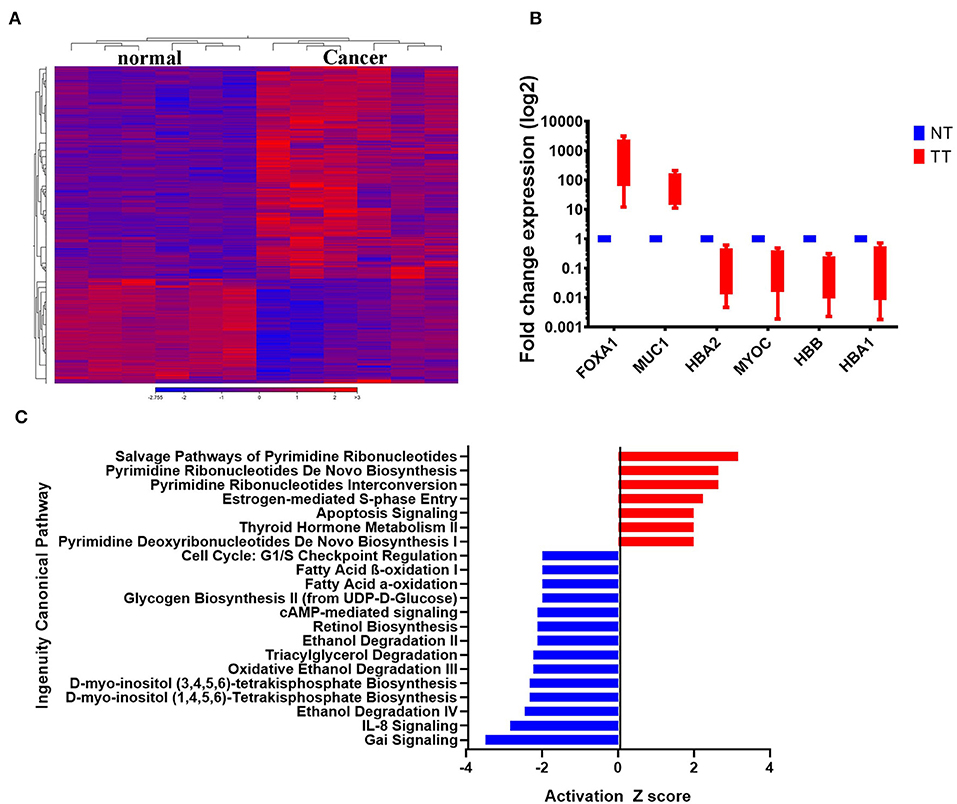
Pathway analysis puts genes from a differential expression analysis into a broader biological context. Simple pathway analyses compare the up- and down-regulated genes statistically to predetermined gene lists. These lists are annotated to biologically meaningful terms, such as a biological process, signaling pathway or a specific disease.
Such analyses may rely either on over-representation analysis or gene set enrichment analysis, which both result in a list of enriched gene sets with relevant statistics and annotations. More mechanistic pathway analyses rely on experimentally validated interactions between genes. They enable identifying not just which pathways are represented by the differentially expressed genes, but also shed light on whether the pathways are activated or inhibited, and by which genes. For the more advanced pathway analyses, we use Ingenuity Pathway Analysis (IPA, QIAGEN). IPA enables a wide range of in-depth analyses into known and novel gene regulatory networks.

Small RNA-sequencing enables studying various species of short RNAs, and microRNAs in particular. MicroRNA-seq analysis is largely similar to that of mRNAs, but pathway and regulatory analyses make use of predicted and/or previously validated microRNA target genes. Sequencing both mRNA and small RNA from the matched samples enables estimating the regulatory relationship between microRNAs and their targets. To identify genes subject to microRNA-mediated regulation in a given condition, argonaute CLIP-sequencing (and related protocols) can be employed.
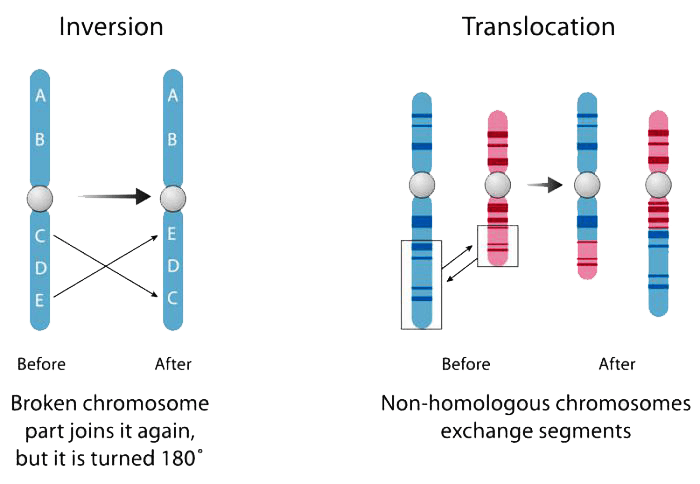
In cancer, certain structural variants are known to cause fusion genes. Two separate genes fused together in the DNA may lead to a fusion transcript. The fusion transcript, in turn, may lead to a fusion protein with a novel, potentially cancer-driving combination of regulation and function. Fusion genes can be detected from RNA-sequencing data with tools that identify and analyze discordantly mapping RNA-seq reads or read pairs.